Tick Abundance Anomaly Calculator
v5
The abundance anomaly calculator estimates the percent change in tick abundance for a target year compared to the previous 5-year average abundance for the same time period. This can help track tick activity in an area over time and between agencies.
Historical 5 Years: The calculation returns the previous 5 years with collections that match the applied collection filters. Years with no collection data will be skipped. For example, a year with no collection events that match the applied collection filters would be skipped, which could result in gaps in historical years (ex: 2024, 2022, 2021, 2001). Specimen filters are applied separately, so you can have years with a 0 value because there were collection events that matched the selected collection filters, but no ticks matching the specimen filters were caught in those collections.
Calculation Settings
- Year: This is the year for which you wish to calculate an abundance anomaly. This year’s abundance at the desired time interval will be compared to the average abundance from the previous 5 years.
-
Time Interval: How frequently should the abundance anomaly be calculated? There are several built-in options: Month, Two Months, Quarter.
-
Calculation Type: Abundance is calculated based on the selected calculation type:
-
Total: \(\text{Abundance} = \text{Total Individuals}\)
-
Per Collection: \(\text{Abundance} = \frac{\text{Total Individuals}}{\text{Total Number of Trapping Opportunities}}\)
-
Density: \(\text{Abundance} = \left(\frac{\text{Total Individuals}}{\text{Total Area}}\right) \times \text{Scale}\)
- Scale (Density Only): Options provided are 1,000, 10,000, 1000,000
- Area Unit (Density Only): Options provided are meters squared (m2) and yards squared (yd2)
-
- Historical Mean Type: The type of mean when calculating the 5-year average abundance to which the current year’s abundance is compared. The default is an arithmetic (average) mean, which is appropriate for most situations, but you can also choose the geometric mean. The formulas used for means are as follows.
For \(x_i\) where \(i = 1\dots n\):
\[\text{Arithmetic mean: } \ \ \bar A =\frac{(x_i + x_{i+1}\dots + x_n)}{n}\] \[\text{Geometric mean: } \ \ \bar G =[(x_i+1)^{\frac{1}{n}}(x_{i+1}+1)^{\frac{1}{n}}...(x_{i+n}+1)^{\frac{1}{n}}]-1\]
Collection Filters
- Agency: By default all agencies you have access to are automatically selected. You can clear a selection by clicking the small x next to the tag or clear all selections by clicking the x to the far right of the input. Multiple agencies in a row can be selected by using the SHIFT key while selecting values. If the Treat each selected agency independently box is checked, the calculation will be run separately per agency. If left unchecked, the calculation will be aggregated for all selected agencies.
- Peer Agency: A peer agency is an agency you do not have access to in the same state as your current agency. You may choose any additional peer agencies for which you wish to calculate an abundance anomaly. This can be used to compare your data to neighboring districts. You can clear a selection by clicking the small x next to the tag or clear all selections by clicking the x to the far right of the input. Multiple agencies in a row can be selected by using the SHIFT key while selecting values. Peer agencies are always calculated independently of the user’s agencies. If the Treat each selected peer agency independently box is checked, the calculation will be run separately per peer agency. If left unchecked, the calculation will be aggregated for all selected peer agencies. Spatial filters are not applied to peer agencies.
- Collection Method: Filter the results by the collection method used for the collection. This is helpful to ensure that results are comparable over time and/or across agencies. Multiple collection methods can be selected by using the SHIFT key while selecting values, and checking the Treat each selected collection method individually box the calculation will be run separately per selected collection method, otherwise the abundance will be aggregated for all selected collection methods.
-
Spatial Filter
The spatial filters refine calculation results by location. If the “Treat each spatial filter independently” box is checked, the calculation will be run separately per spatial filter, otherwise abundance will be aggregated for the selection. Spatial filters only apply to selected agencies; you cannot calculate abundance within spatial features for peer agencies. Instead, all tick abundance from selected peer agencies is used for the calculation.

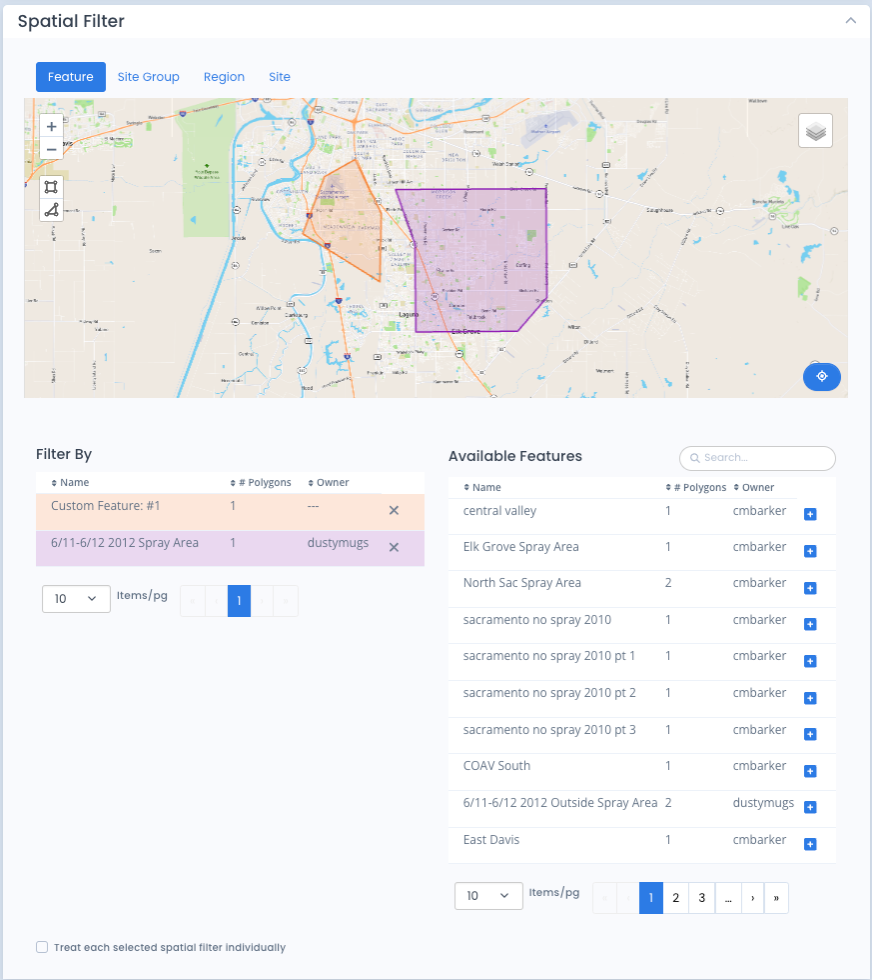
- Feature: Users can draw a polygon on the map or choose from available features. Available features include those derived by the system based on the user’s agency boundaries and those features defined for the agency on the Spatial Features page. Clicking on a polygon will provide details for the feature, including area, name, and number of vertices.
- Site Group: If your agency has defined any Site Groups they will be listed as options in the multi-select field here. Selecting a group will populate the map with the appropriate site markers. Clicking on a marker will provide details for the site, including coordinates, site name, and site group name.
- Region: The Available regions table on this tab will be populated with any region that has been utilized by site in the user’s agency. Clicking on a polygon will provide details for the region, including area, name, and number of vertices.
- Site: The site filter multi-select will have all sites from selected agencies (but not Peer Agencies) available. Typing in the field will fetch a new set of up to 50 sites based on the text. Holding down the shift key while selecting sites will allow the user to grab multiple sites at once. Due to the large number of possible sites calculation results cannot be stratified by individual sites. The “Treat each spatial filter independently” box is not available on this tab.

When available, clicking on the “Recenter” button in the lower right corner of the map will cause the map to center on the chosen spatial filters.
-
Surroundings
These are optional filters. The default settings do not restrict the data in any way. Only modify these settings if you want to further restrict the data.
- Humidity/Wind Speed/Temperature: Ranged inputs can accept a min/max or both. A unit preference select is provided where needed. This should default to the user’s saved Account Preferences. Include unknown checkbox: check to include collections where the humidiy/wind speed/temperature was not recorded. Include unknown only needs to be checked if a range value is provided, otherwise no filter is applied.
- Moisture/Sunlight/Vegetation/Population: Multiple options can be selected by using the SHIFT key while selecting values. Include unknown checkbox: check to include collections where the Moisture/Sunlight/Vegetation/Population was not recorded. Include unknown only needs to be checked if a value is selected, otherwise no filter is applied.
Specimen Filters
- Species: Here you can choose whether to look at the abundance anomaly for all species or selected species of interest. Multiple species in a row can be selected by using the SHIFT key while selecting values. If the Treat each selected species independently box is checked, the calculation will be run separately per species, otherwise abundance will be aggregated for all selected species.
- Sex/Stage: Typically, females are of interest when calculating the abundance anomaly, but you could also examine males, unknown sex, eggs, larvae, and pupae. Multiple values can be selected by using the SHIFT key while selecting values, and checking the Treat each selected sex/stage individually box the calculation will be run separately per sex/stage selection, otherwise the abundance will be aggregated for all selected sex/stage.
- Attached: By default All Available is selected, meaning all ticks whether they were attached or not are included. You can also select ‘Only attached’ to include ticks that were marked as attached on the abundance or select ‘Only non-attached’ to exclude ticks that were attached. You can also select both and tick the Treat each selected Attached individually box to run attached vs non-attached as separate calculations.
- Bloodfed: Similar to Attached above, by default All Available is selected, meaning all ticks whether they were bloodfed or not are included. You can also select ‘Only bloodfed’ to include ticks that were marked as bloodfed on the abundance or select ‘Only non-bloodfed’ to exclude ticks that were bloodfed. You can also select both and tick the Treat each selected Bloodfed individually box to run bloodfed vs non-bloodfed as separate calculations.
The # of Calculations indicator shows how many calculations will be performed based on the stratifications (checkboxes) that have been selected. If none of the boxes were checked, abundance at the desired time interval will be aggregated to a single calculation. (Two if at least one peer agency was selected.)
Results
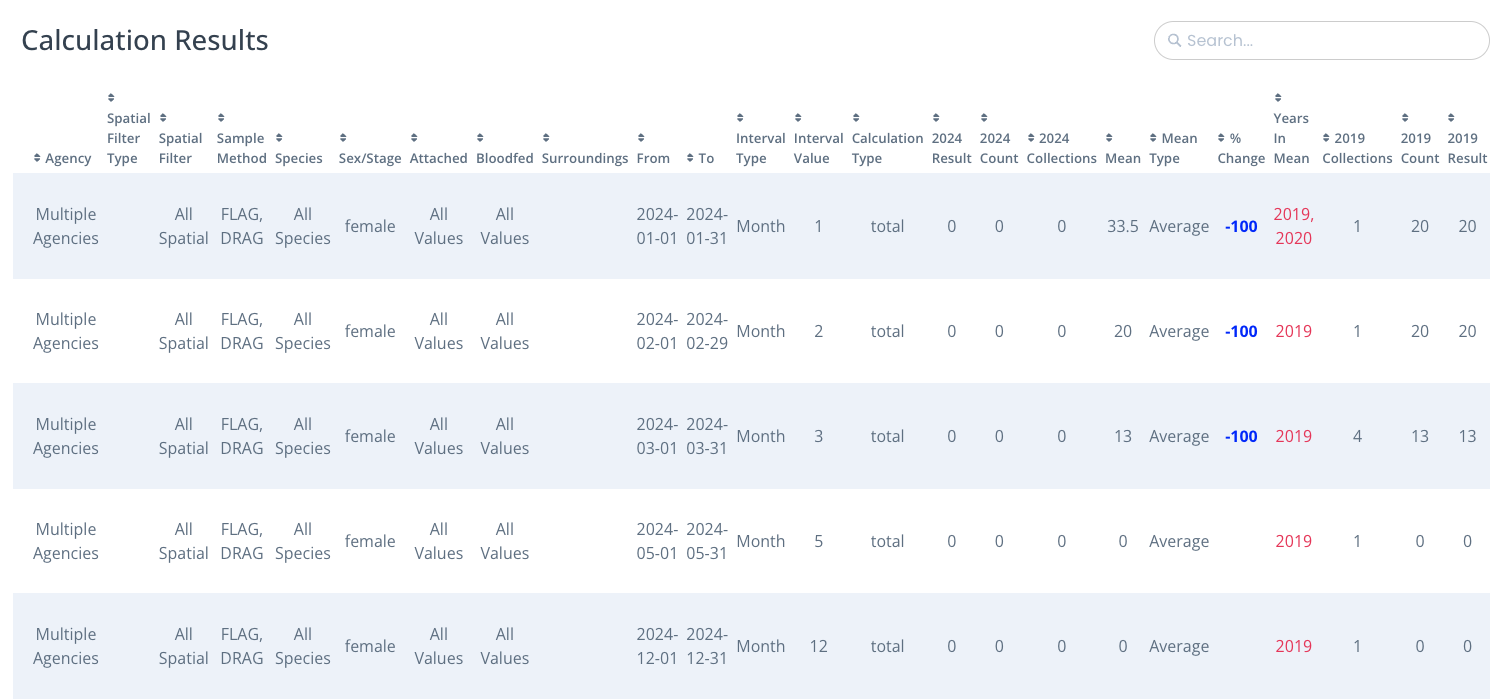
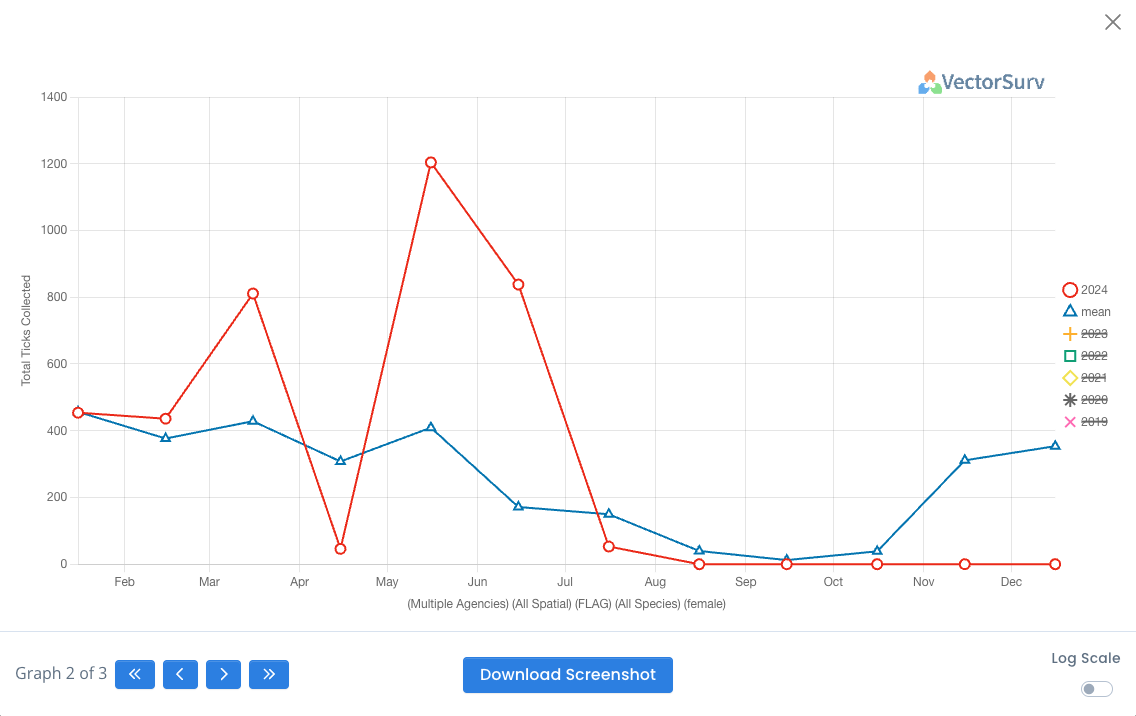
The resulting table is downloadable. Select your preferred file format and click the blue download button to the right. You also have the option to view a time series graph comparing the current year’s abundance curve to the 5-year average abundance curve, shown at the bottom of this page.

- Result: Abundance is indicated by the selected calculation year column (ex: ‘2024 Value’). How the abundance is calculated is determined by the selected Calculation Type. The abundance value per row is for the time interval.
- Collections: The total trapping events matching selected filters for the time interval.
- Count: The total number of ticks matching species and sex/stage filters for the time interval.
- Area: Only appears if density was selected for calculation type. Sum of area recorded for trapping events matching selected filters for the time interval.
- Mean: The five-year average abundance calculated as specified for the time interval.
- Years in Mean: The available years included in the five-year average. If a year is not present, then there is no data currently in the system for that year. Years will display in red if less than 3 years of data are included or there are gaps in the years.

- «: Go to first graph. Only shown if more than two graphs are available.
- <: Go to previous graph. Only shown if more than one graph is available.
- >: Go to next graph. Only shown if more than one graph is available.
- »: Go to last graph. Only shown if more than two graphs are available.
- Download Screenshot: Downloads a png of the selected graph.
- Log Scale: Converts the y-axis to use a logarithmic scale. A logarithmic scale is useful for visualizing data with a wide range of values, compressing large numbers and expanding smaller ones.
- Viewing Historical Years: By default only the lines for the selected year and the mean show on the graph. To the right of the graph is a legend of the lines. Crossed out lines are available, but not currently visible on the graph. Clicking on any item in the legend will toggle its visibility on the graph.
Calculation Presets

To load a previously saved calculation click on the ‘Select A Calculation’ dropdown and select a preset. The selected default calculation will be marked with an * after the name. Calculations are grouped by calculations private to you (User) and by calculations that have been shared with the agency you are currently logged in under (these might be owned by you or owned by others and shared with you through your access to the agency).
To save a calculation for future use, you can click the Save Calculation button at the bottom right of the page or click the pencil icon to the right of the calculation select dropdown, as seen in the image above.
- Name: Provide a name for the calculation so you can identify it in the dropdown select later.
- Share With Agency: This lets you share the current calculation with other members of the agency you are currently logged in under. Only you can edit the calculation name and configuration, but an agency manager can elect to unshare any calculation shared with their agency. Other members of your agency may also save personal copies of a shared calculation.
- Set as Default: This option lets you set a calculation as your default. Whenever you visit the Tick Abundance Anomaly calculator page, it will load the selected default calculation. There can only be one default. This appears as a checkbox when saving a new calculation. When updating an existing calculation, click on the thumback icon in the modal header. When the icon is grey, the calculation is not set as the default. If the thumbtack is blue, the calculation is the current default.
 .
. - Save updates to calculation settings: This only appears when you have loaded a preset and made changes to the inputs on the calculation form. By default this is checked. However, if you made changes to the calculation that you don’t want to save, but you want to change the preset name or share with the preset with our agency, you may uncheck this box to ensure only the preset settings update, not the calculation settings themselves.
- Save As New: Save a copy of this calculation that will be owned by you.