Risk Assessment
Gateway URL: https://gateway.vectorsurv.org/core/ppf/risk_assessment_calc
Video Tutorial: https://youtu.be/MqDhD2tZ7s8
This calculator is based upon the Risk Assessment model found in the California Mosquito-borne Virus Surveillance and Response Plan. The environmental component (temperature and precipitation) of this calculator uses daily meteorological surfaces generated from the North American Land Data Assimilation System (NLDAS) provided by NASA Goddard Space Flight Center. The infection rate component of this calculator is based upon the CDC/DVBID MLE/MIR MS Excel add-in.
Fields
- Peer Agency: Your agency is automatically selected. You may choose any additional peer agencies for which you wish to calculate a risk assessment. This can be used to compare your data to neighboring districts. Multiple peer agencies can be selected by using the CTRL/CMD/SHIFT keys while selecting values. If the Treat each selected agency independently box is checked, the risk assessment will be stratified by agency (this is ignored if only one agency is selected). If left unchecked, the abundance anomaly will be aggregated for all selected peer agencies. Your agency will always be treated separately.
- Peer Agency: These are agencies whose information you do not have access to. Any calculations run for these agencies are done at the agency-level, so any spatial filters will be ignored.
- Year: This is the year for which you wish to calculate a risk assessment. When calculating the abundance anomaly component, this year’s abundance at the desired time interval will be compared to the average abundance from the previous 5 years.
- Time Interval: How frequently should the risk assessment components be calculated? There are several built-in options, or you can manually specify a date range within the selected year. Date format is based on the settings under Account Preferences.
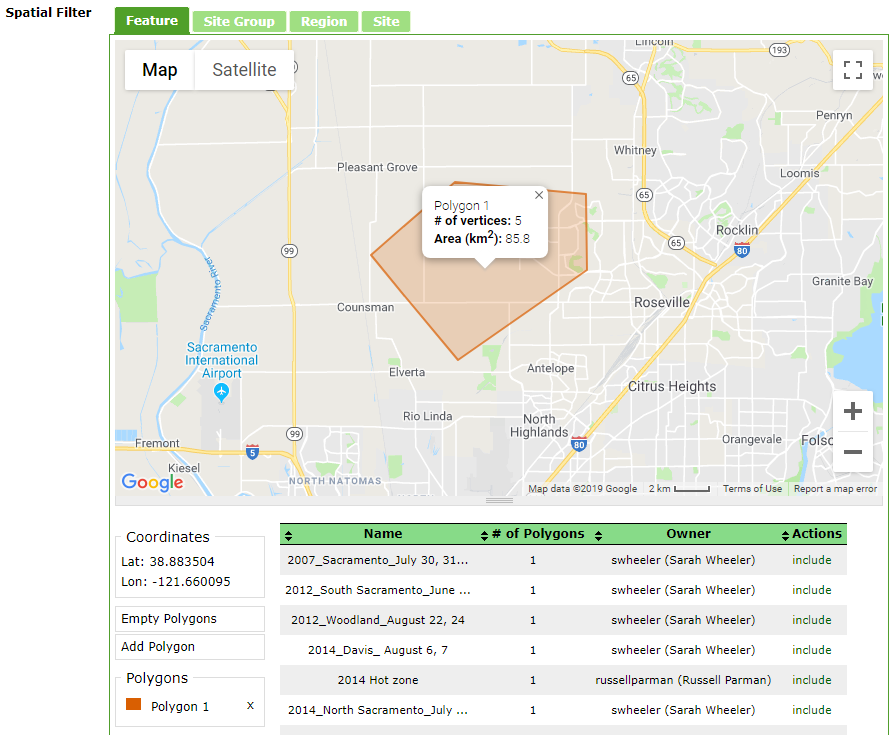
- Spatial Filter: This feature allows you to filter results within the agency or agencies. You can draw a polygon on the map using the feature tab, or include a previously saved feature from the Spatial Features page.
 Alternatively, you can filter by site group, region (determined when creating a new site), or specific site. For these filters, multiple values can be selected by using the CTRL/CMD/SHIFT keys while selecting values. If the Treat each selected filter independently box is checked, the risk assessment will be stratified by spatial filter, otherwise it will be aggregated for the selection. If the “All Available…” option is selected or no feature polygon(s) is provided, any calculation(s) will not use spatial filters.
 - Buffer Distance: The distance outside the specific region encompassing the broad region. The default is 150 miles (~241 km). Changing this value is strongly discouraged.
- Target/Virus: The pathogen for which you wish to estimate the pool infection rate component.
- Species: Here you can choose whether to look at the risk assessment for all species or selected species of interest. Multiple species can be selected by using the CTRL/CMD/SHIFT keys while selecting values. If the Treat each selected species independently box is checked, the risk assessment will be stratified by species, otherwise the risk assessment will be aggregated for all selected species.
- Sex/Condition: Typically, females of various conditions are of interest when conducting the risk assessment, but you could also examine males, unknown sex, eggs, larvae, and pupae. Multiple values can be selected by using the CTRL/CMD/SHIFT keys while selecting values, and checking the Treat each selected sex/condition individually box will stratify the risk assessment by the selected values.
- Trap Type: Filter the results by the trap type used for the collection. This is helpful to ensure that results are comparable over time and/or across agencies. Similar to Sex/Condition, multiple trap types can be selected by using the CTRL/CMD/SHIFT keys while selecting values, and checking the Treat each selected trap type individually box will stratify the risk assessment by the selected traps.
- Historical Mean Type: The type of mean when calculating the 5-year average abundance to which the current year’s abundance is compared (for the abundance anomaly component). The default is a geometric mean, which is appropriate for most situations, but you can also choose the arithmetic mean (average), harmonic mean, or the weighted version of any of these three options.
- Carcass Period: The number of days considered for carcass infections. 30 days is the approximate number of days in a given month. The California Risk Assessment model suggests the use of the prior three months (approximately 91 days).
Results
The # of Calculations indicator shows how many calculations will be performed based on the stratifications (checkboxes) that have been selected. If none of the boxes were checked, the risk assessment at the desired time interval will be aggregated to a single calculation. The values for Environment, Abundance, Infection, Seroconversion, and Dead Bird are derived from the California Mosquito-Borne Virus Surveillance & Response Plan and range from 1 (lowest risk) to 5 (highest risk). The overall Risk is the average of these values for a given time interval. The resulting table shows the risk on a yellow (lowest) to red (highest) color scale and is downloadable. You can also download the data that went into the calculation.