Vector Index
The vector index is the relative abundance of infected mosquitoes and is a way to quickly estimate the risk of arbovirus transmission in an area. Vector index is the product of the abundance and infection rate for a given time interval:
\[\text{VI = Abundance} \times \text{Infection Rate}\]Fields
- Peer Agency: Your agency is automatically selected. You may choose any additional peer agencies for which you wish to calculate vector index. This can be used to compare your data to neighboring districts. Multiple peer agencies can be selected by using the CTRL/CMD/SHIFT keys while selecting values. If the Treat each selected agency independently box is checked, the vector index will be stratified by peer agency (this is ignored if only one agency is selected). If left unchecked, vector index will be aggregated for all selected peer agencies. Your agency will always be treated separately.
- Year: This is the year for which you wish to calculate a vector index. When calculating the abundance anomaly component, this year’s abundance at the desired time interval will be compared to the average abundance from the previous 5 years.
- Time Interval: How frequently should the vector index components be calculated? There are several built-in options, or you can manually specify a date range within the selected year. Date format is based on the settings under Account Preferences.
- Spatial Filter: This feature allows you to filter results within your agency. You can draw a polygon on the map using the feature tab, or include a previously saved feature from the Spatial Features page.
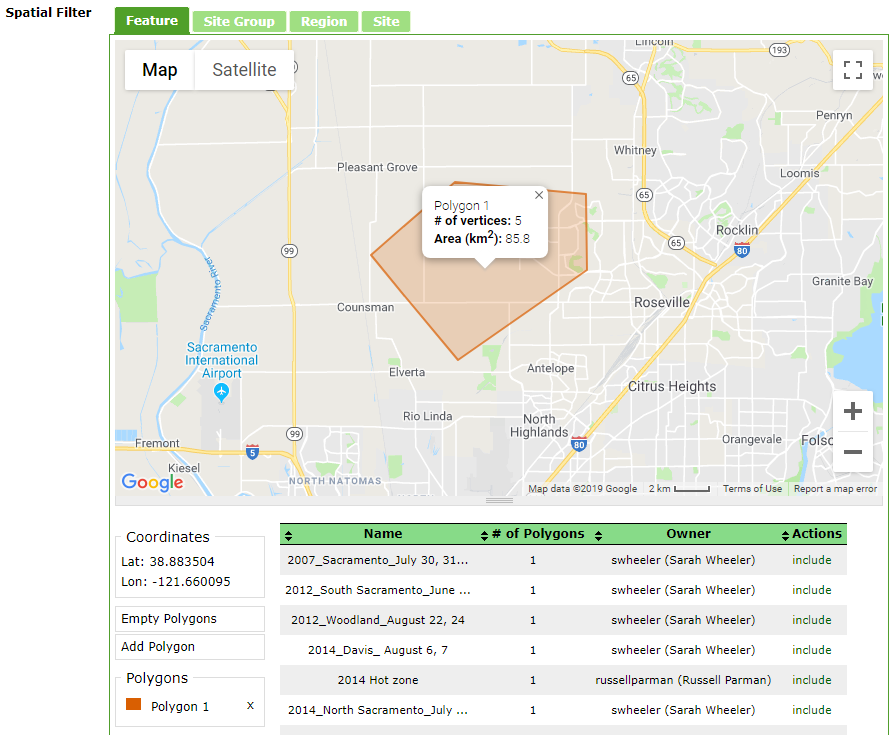 Alternatively, you can filter by site group, region (determined when creating a new site), or specific site. For these filters, multiple values can be selected by using the CTRL/CMD/SHIFT keys while selecting values. If the Treat each selected filter independently box is checked, the vector index will be stratified by spatial filter, otherwise it will be aggregated for the selection. If the “All Available…” option is selected or no feature polygon(s) is provided, any calculation(s) will not use spatial filters. Spatial features only apply to your agency; you cannot calculate abundance anomaly within spatial features for peer agencies. Instead, abundance anomalies are calculated for whole peer agencies.
 - Target/Virus: The pathogen for which you wish to estimate the pool infection rate component.
- Species: Here you can choose whether to look at the vector index for all species or selected species of interest. Multiple species can be selected by using the CTRL/CMD/SHIFT keys while selecting values. If the Treat each selected species independently box is checked, the vector index will be stratified by species, otherwise it will be aggregated for all selected species.
- Sex/Condition: Typically, females of various conditions are of interest when calculating the vector index, but you could also examine males, unknown sex, eggs, larvae, and pupae. Multiple values can be selected by using the CTRL/CMD/SHIFT keys while selecting values, and checking the Treat each selected sex/condition individually box will stratify the vector index by the selected values.
- Trap Type: Filter the results by the trap type used for the collection. This is helpful to ensure that results are comparable over time and/or across agencies. Similar to Sex/Condition, multiple trap types can be selected by using the CTRL/CMD/SHIFT keys while selecting values, and checking the Treat each selected trap type individually box will stratify the vector index by the selected traps.
- Trap Night Restrictions: You can further restrict the collections used to calculate the vector index by the number of trap nights a trap was set for.
-
Point Estimate: The infection rate estimation method. The bias-corrected MLE will be appropriate for most situations, but you can also choose to use the MLE or MIR methods.
If all arthropods were to be tested individually for a given pathogen, the true infection rate could be calculated simply as \(\frac{\text{Number of Infected Arthropods}} {\text{Number of Individuals Tested}} \times {\text{Scale}}\) . However, in most cases, arthropods are not tested for pathogens individually, and the actual number of pathogen-positive arthropods in a positive pool is subject to some uncertainty. Fortunately, infection rates can be estimated using the following methods:
-
MIR: Testing arthropods in pools can yield only a single positive per pool, which does not allow for certainty about the number of infected individuals within the pool. Minimum Infection Rate makes the assumption that there is only one positive arthropod in a positive pool. MIR is not always a reliable estimate of the true infection rate, as it is possible for multiple positive arthropods to be present in a positive pool. This is particularly true when infection rates are high. MIR is calculated as \(\text{MIR} = \frac{\text{Number Positive Pools}} {\text{Total Number Individuals}} \times \text{Scale}\)
-
MLE: Maximum Likelihood Estimate Infection Rate is estimated using a binomial model to approximate the infection rate based on the available data. The spread and center of the data is used to derive confidence intervals. Confidence intervals can be interpreted as the range of possible estimates for infection rate and a 95% confidence interval indicates you can be 95% confident that the true infection rate is within the given interval. The wider the confidence interval, the greater the uncertainty about the point estimate.
-
Bias-Corrected MLE: The standard MLE can have significant bias depending on the quantity and quality of available data. The bias-corrected MLE seeks to reduce this bias and is the recommended point estimate when sample size is small. The bias-corrected MLE will be appropriate for most situations.
Note: The MLE and Bias-Corrected MLE calculations are not designed for situations where all tests are positive. If one of these methods is chosen and all pools for a given time period are positive, VectorSurv’s calculator will not return an estimate for infection rate or vector index for that time period. We recommend using MIR to estimate the infection rate and vector index for such situations.
-
- Scale: Choose your preferred scale for the infection rate estimate and resulting vector index. The default value is 1,000, which gives infection rates and vector indices calculated on a per-1,000 basis. If instead, you want to calculate as percent (per 100), you may choose 100 for the scale. As an example, if you were to choose a scale of 1,000, and your calculation returns a vector index of 500, this corresponds to 500 infected arthropods per 1,000 trap-nights. If you had instead chosen a scale of 100, the same calculation would return a vector index of 50, which corresponds to 50 infected arthropods per 100 trap-nights.
Results
The # of Calculations indicator shows how many calculations will be performed based on the stratifications (checkboxes) that have been selected. If none of the boxes were checked, the vector index at the desired time interval will be aggregated to a single calculation. The resulting table showing the vector abundance for the selected year and the previous 5 years is downloadable. You also have the option to view a time series graph comparing the vector index at the selected time interval.
- Vector Index (VI): Vector index result which is calculated by multiplying the infection rate by the abundance for each interval
- Abundance: Abundance is defined as the total number of arthropods collected divided by the total number of trap-nights for a given time interval
- Infection Rate: Infection rate point estimate calculated from the selected method
- Count: The interval sum of arthropods used in the abundance calculation.
- Trap Nights: The total trapping effort for the time interval. This value is the interval sum of the number of traps set for a collection times the number of nights the traps were run for the trap types of interest. For example, if a week contained two collections with CO2 traps: 5 traps run for 4 nights and 2 traps run for 1 night, the Trap Nights for that week would be: \((5 \times 4) + (2 \times 1) = 22\) regardless of whether the species of interest was found in these trap collections.
- Pools: The total number of pools used in the calculation for infection rate