Abundance Anomaly
Gateway URL: https://gateway.vectorsurv.org/arthro/ppf/collection_calc
Video Tutorial: https://youtu.be/KDCsKHaNHiI
The abundance anomaly calculator estimates the percent change in arthropod abundance for a target year compared to the previous 5-year average abundance for the same time period. This can help track arthropod activity in an area over time and between agencies.
Abundance is calculated using the formula:
\[\text{Abundance} = \frac{\text{Total Individuals}}{\text{Total Number of Trapping Opportunities}}\]Fields
- Peer Agency: Your agency is automatically selected. You may choose any additional peer agencies for which you wish to calculate an abundance anomaly. This can be used to compare your data to neighboring districts. Multiple peer agencies can be selected by using the CTRL/CMD/SHIFT keys while selecting values. If the Treat each selected agency independently box is checked, the abundance anomaly will be stratified by peer agency (this is ignored if only one peer agency is selected). If left unchecked, the abundance anomaly will be aggregated for all selected peer agencies. Your agency will always be treated separately.
- Year: This is the year for which you wish to calculate an abundance anomaly. This year’s abundance at the desired time interval will be compared to the average abundance from the previous 5 years.
- Time Interval: How frequently should the abundance anomaly be calculated? There are several built-in options, or you can manually specify a date range within the selected year. Date format is based on the settings under Account Preferences.
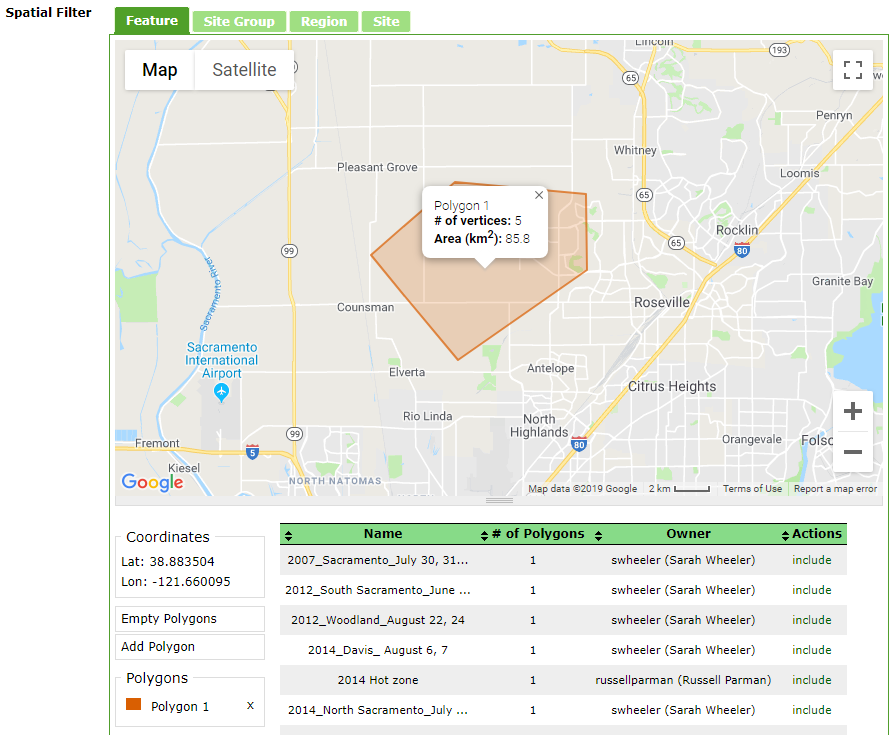
- Spatial Filter: Spatial features allow you to filter results within your agency. You can draw a polygon on the map using the feature tab, or include a previously saved feature from the Spatial Features page.
 Alternatively, you can filter by site group, region (determined when creating a new site), or specific site. For these filters, multiple values can be selected by using the CTRL/CMD/SHIFT keys while selecting values. If the Treat each selected filter independently box is checked, the abundance anomaly will be stratified by spatial filter, otherwise abundance will be aggregated for the selection. If the “All Available…” option is selected or no feature polygon(s) is provided, any calculation(s) will not use spatial filters. Spatial features only apply to your agency; you cannot calculate abundance anomaly within spatial features for peer agencies. Instead, abundance anomalies are calculated for whole peer agencies.
 - Species: Here you can choose whether to look at the abundance anomaly for all species or selected species of interest. Multiple species can be selected by using the CTRL/CMD/SHIFT keys while selecting values. If the Treat each selected species independently box is checked, the abundance anomaly will be stratified by species, otherwise abundance will be aggregated for all selected species.
- Sex/Condition: Typically, females of various conditions are of interest when calculating the abundance anomaly, but you could also examine males, unknown sex, eggs, larvae, and pupae. Multiple values can be selected by using the CTRL/CMD/SHIFT keys while selecting values, and checking the Treat each selected sex/condition individually box will stratify the abundance anomaly by the selected values.
-
Trap Type: Filter the results by the trap type used for the collection. This is helpful to ensure that are comparable over time and/or across agencies. Similar to Sex/Condition, multiple trap types can be selected by using the CTRL/CMD/SHIFT keys while selecting values, and checking the Treat each selected trap type individually box will stratify the abundance anomaly by the selected traps.
- Historical Mean Type: The type of mean when calculating the 5-year average abundance to which the current year’s abundance is compared. The default is a arithmetic mean, which is appropriate for most situations, but you can also choose the geometric mean. The formulas used for means are as follows.
For \(x_i\) where \(i = 1\dots n\):
\[\text{Arithmetic mean: } \ \ \bar A =\frac{(x_i + x_{i+1}\dots + x_n)}{n}\] \[\text{Geometric mean: } \ \ \bar G =[(x_i+1)^{\frac{1}{n}}(x_{i+1}+1)^{\frac{1}{n}}...(x_{i+n}+1)^{\frac{1}{n}}]-1\]The # of Calculations indicator shows how many calculations will be performed based on the stratifications (checkboxes) that have been selected. If none of the boxes were checked, abundance at the desired time interval will be aggregated to a single calculation.
Results
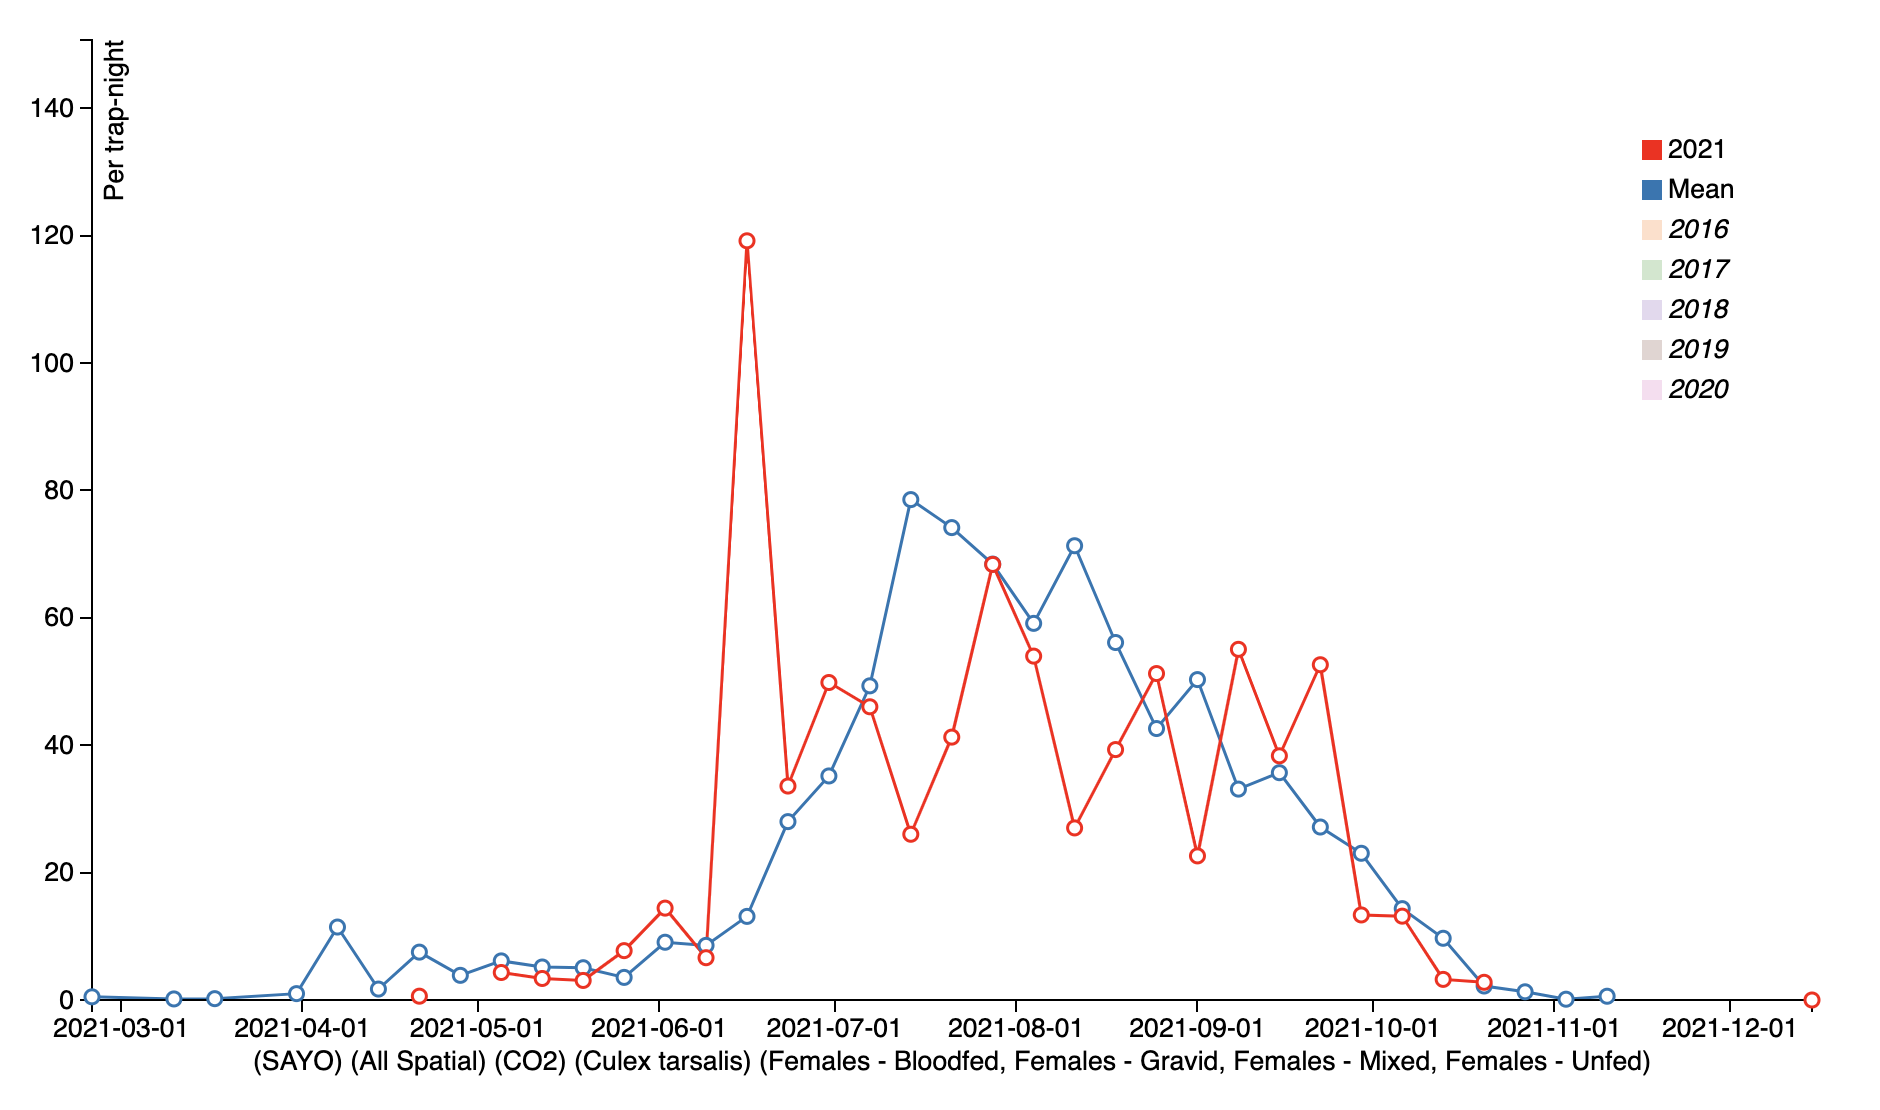
The resulting table is downloadable, and you also have the option to view a time series graph comparing the current year’s abundance curve to the 5-year average abundance curve, shown at the bottom of this page.
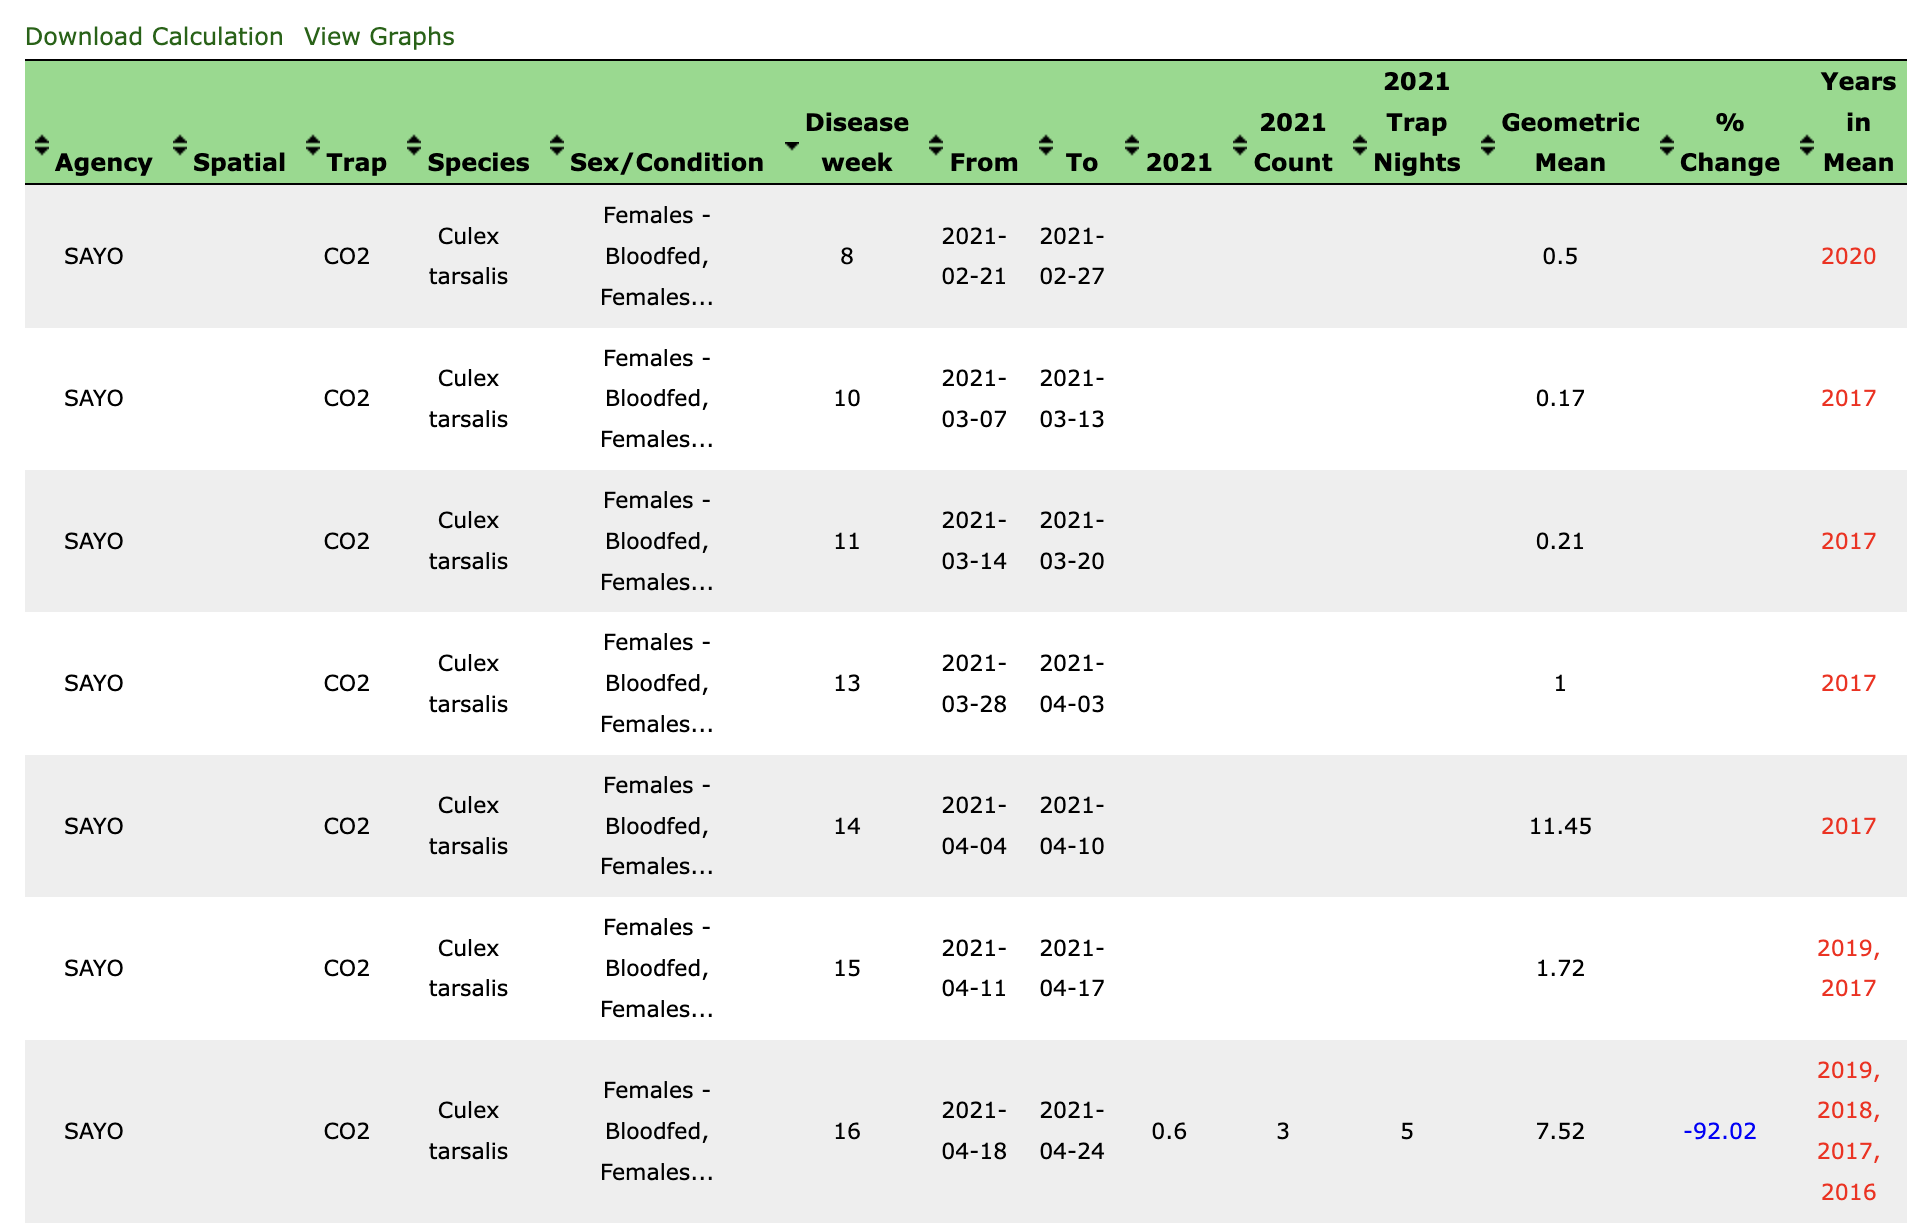
- Abundance: Abundance, indicated by the year column, is defined as the total number of species collections divided by the total number of trapping opportunities for a given time interval
-
Trap Nights: The total trapping opportunities for the time interval. This value is the interval sum of the number of traps set for a collection times the number of nights the traps were run for the trap types of interest. For example, if a week contained two collections with CO2 traps: 5 traps run for 4 nights and 2 traps run for 1 night, the Trap Nights for that week would be:$(5 * 4) + (2 * 1) = 22$ regardless if the species of interest was found at either collections’ traps. Essentially, trapping opportunities is dependent on the trap type.
- Count: The yearly interval sum of arthropods used in the abundance calculation.
- Average Mean: The five-year average abundance calculated as specified
- Years in Mean: The available years included in the five-year average. If a year is not present, then there is no data currently in the system for that year.