Dengue Risk Map
Dengue Risk Estimation
Overview
The VectorSurv risk map for dengue utilizes counts of adult female Aedes aegypti from traps reported in VectorSurv alongside environmental temperature data to estimate the relative risk of additional locally-transmitted dengue virus infections following the arrival of an initial infectious person. VectorSurv’s estimates should be regarded as an estimate of the relative potential for transmission of dengue virus in an area. The potential for dengue virus-infected travelers to introduce the virus into a given area also varies over space and time, but since this is unknown, it is not included in the estimated risk.
This map provides VectorSurv users with a more dynamic, real-time view of potential dengue virus transmission risk per week and census county subdivision. Each week’s estimated risk is based on that week’s temperatures and the relative abundance of Aedes aegypti found in CO2-baited and/or Biogents (BG) Sentinel traps during the prior four weeks.
This document describes how the relative risk is estimated, including definitions for all model parameters. Our calculation of relative risk is derived from the basic reproduction number, \(R_0\), which is a theoretical representation of potential transmission for a pathogen. If interpreted in a strict sense, \(R_0\) would be the average number of secondary infections expected to arise from a single infectious individual in a fully susceptible (i.e., non-immune) population. This serves as an indicator of invasion potential for a pathogen. In our VectorSurv implementation, the \(R_0\) depends on assumptions about (1) the relationship between observed mosquito trap counts and the true density of mosquitoes that bite people, and (2) the relationship between temperatures and mosquito biting rate, survival, and the incubation period for dengue. Therefore, estimates should be interpreted only in a relative sense, such that higher values represent higher risk for transmission and lower values indicate lower transmission risk. There is not a single threshold value that can be used for determining whether an outbreak will occur in a given area. For our purposes, we refer to our estimates of \(R_0\) as a “relative risk” on VectorSurv’s maps.
The relative risk for dengue was calculated using the classical formula for the basic reproduction number:
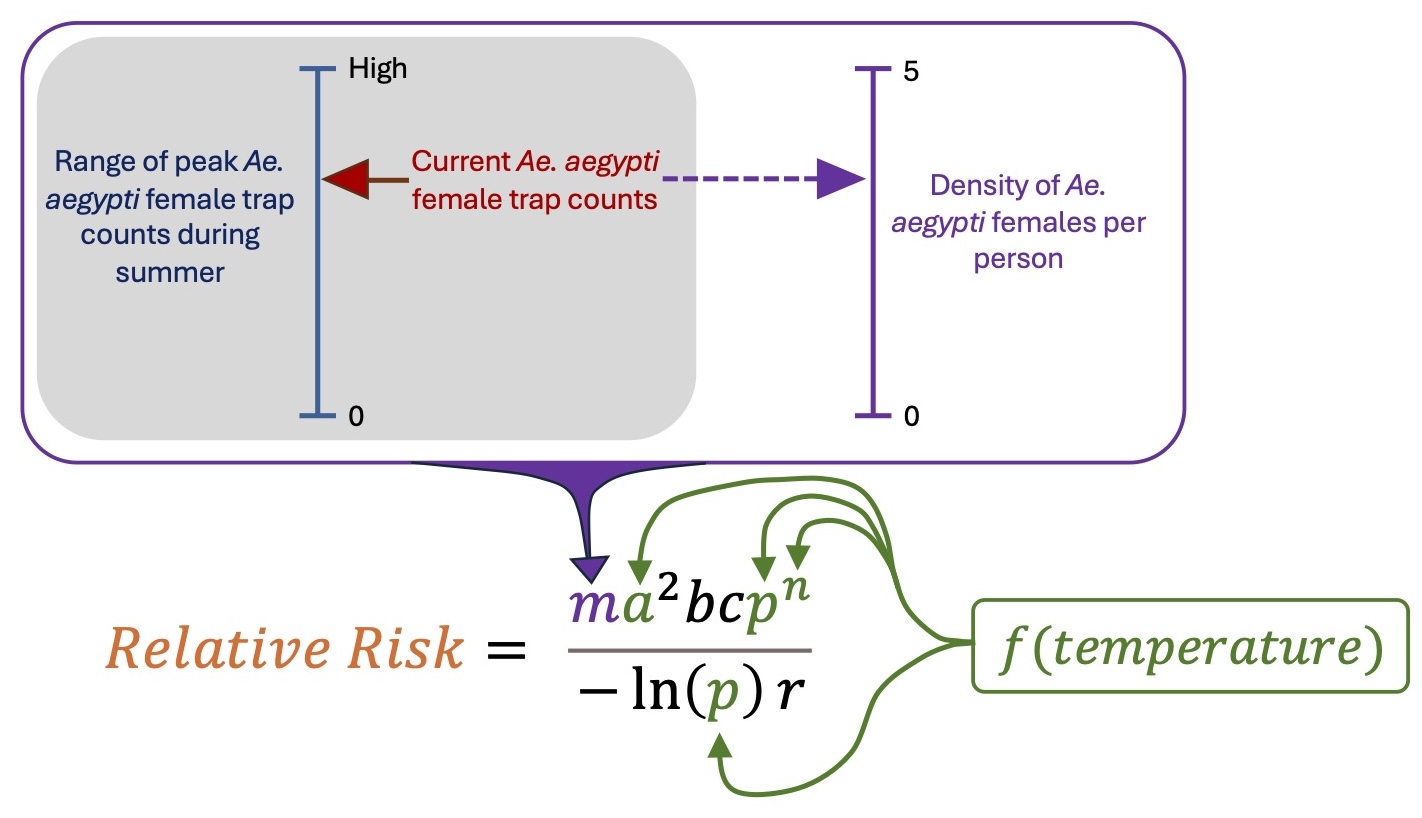
\[{\text{Relative Risk}} = \frac{ma^2 bcp^n}{-ln(p)r}\]where m is mosquito density (mosquitoes per person), a is biting rate (bites per day per mosquito), b is transmission efficiency from mosquito to human (probability a human becomes infected if the mosquito is infectious at time of biting), c is transmission efficiency from human to mosquito (probability a mosquito becomes infected if the human is infectious at time of biting), p is mosquito survival (proportion surviving per day), n is the number of days required for the virus to replicate and become transmissible by the mosquito, and r is the human recovery rate (1 / infectious period).
The graphical overview below shows the assumed relationship between trap counts and adult female Ae. aegypti densities and the parameters that are estimated as functions of temperature.
Calculating Dengue Risk
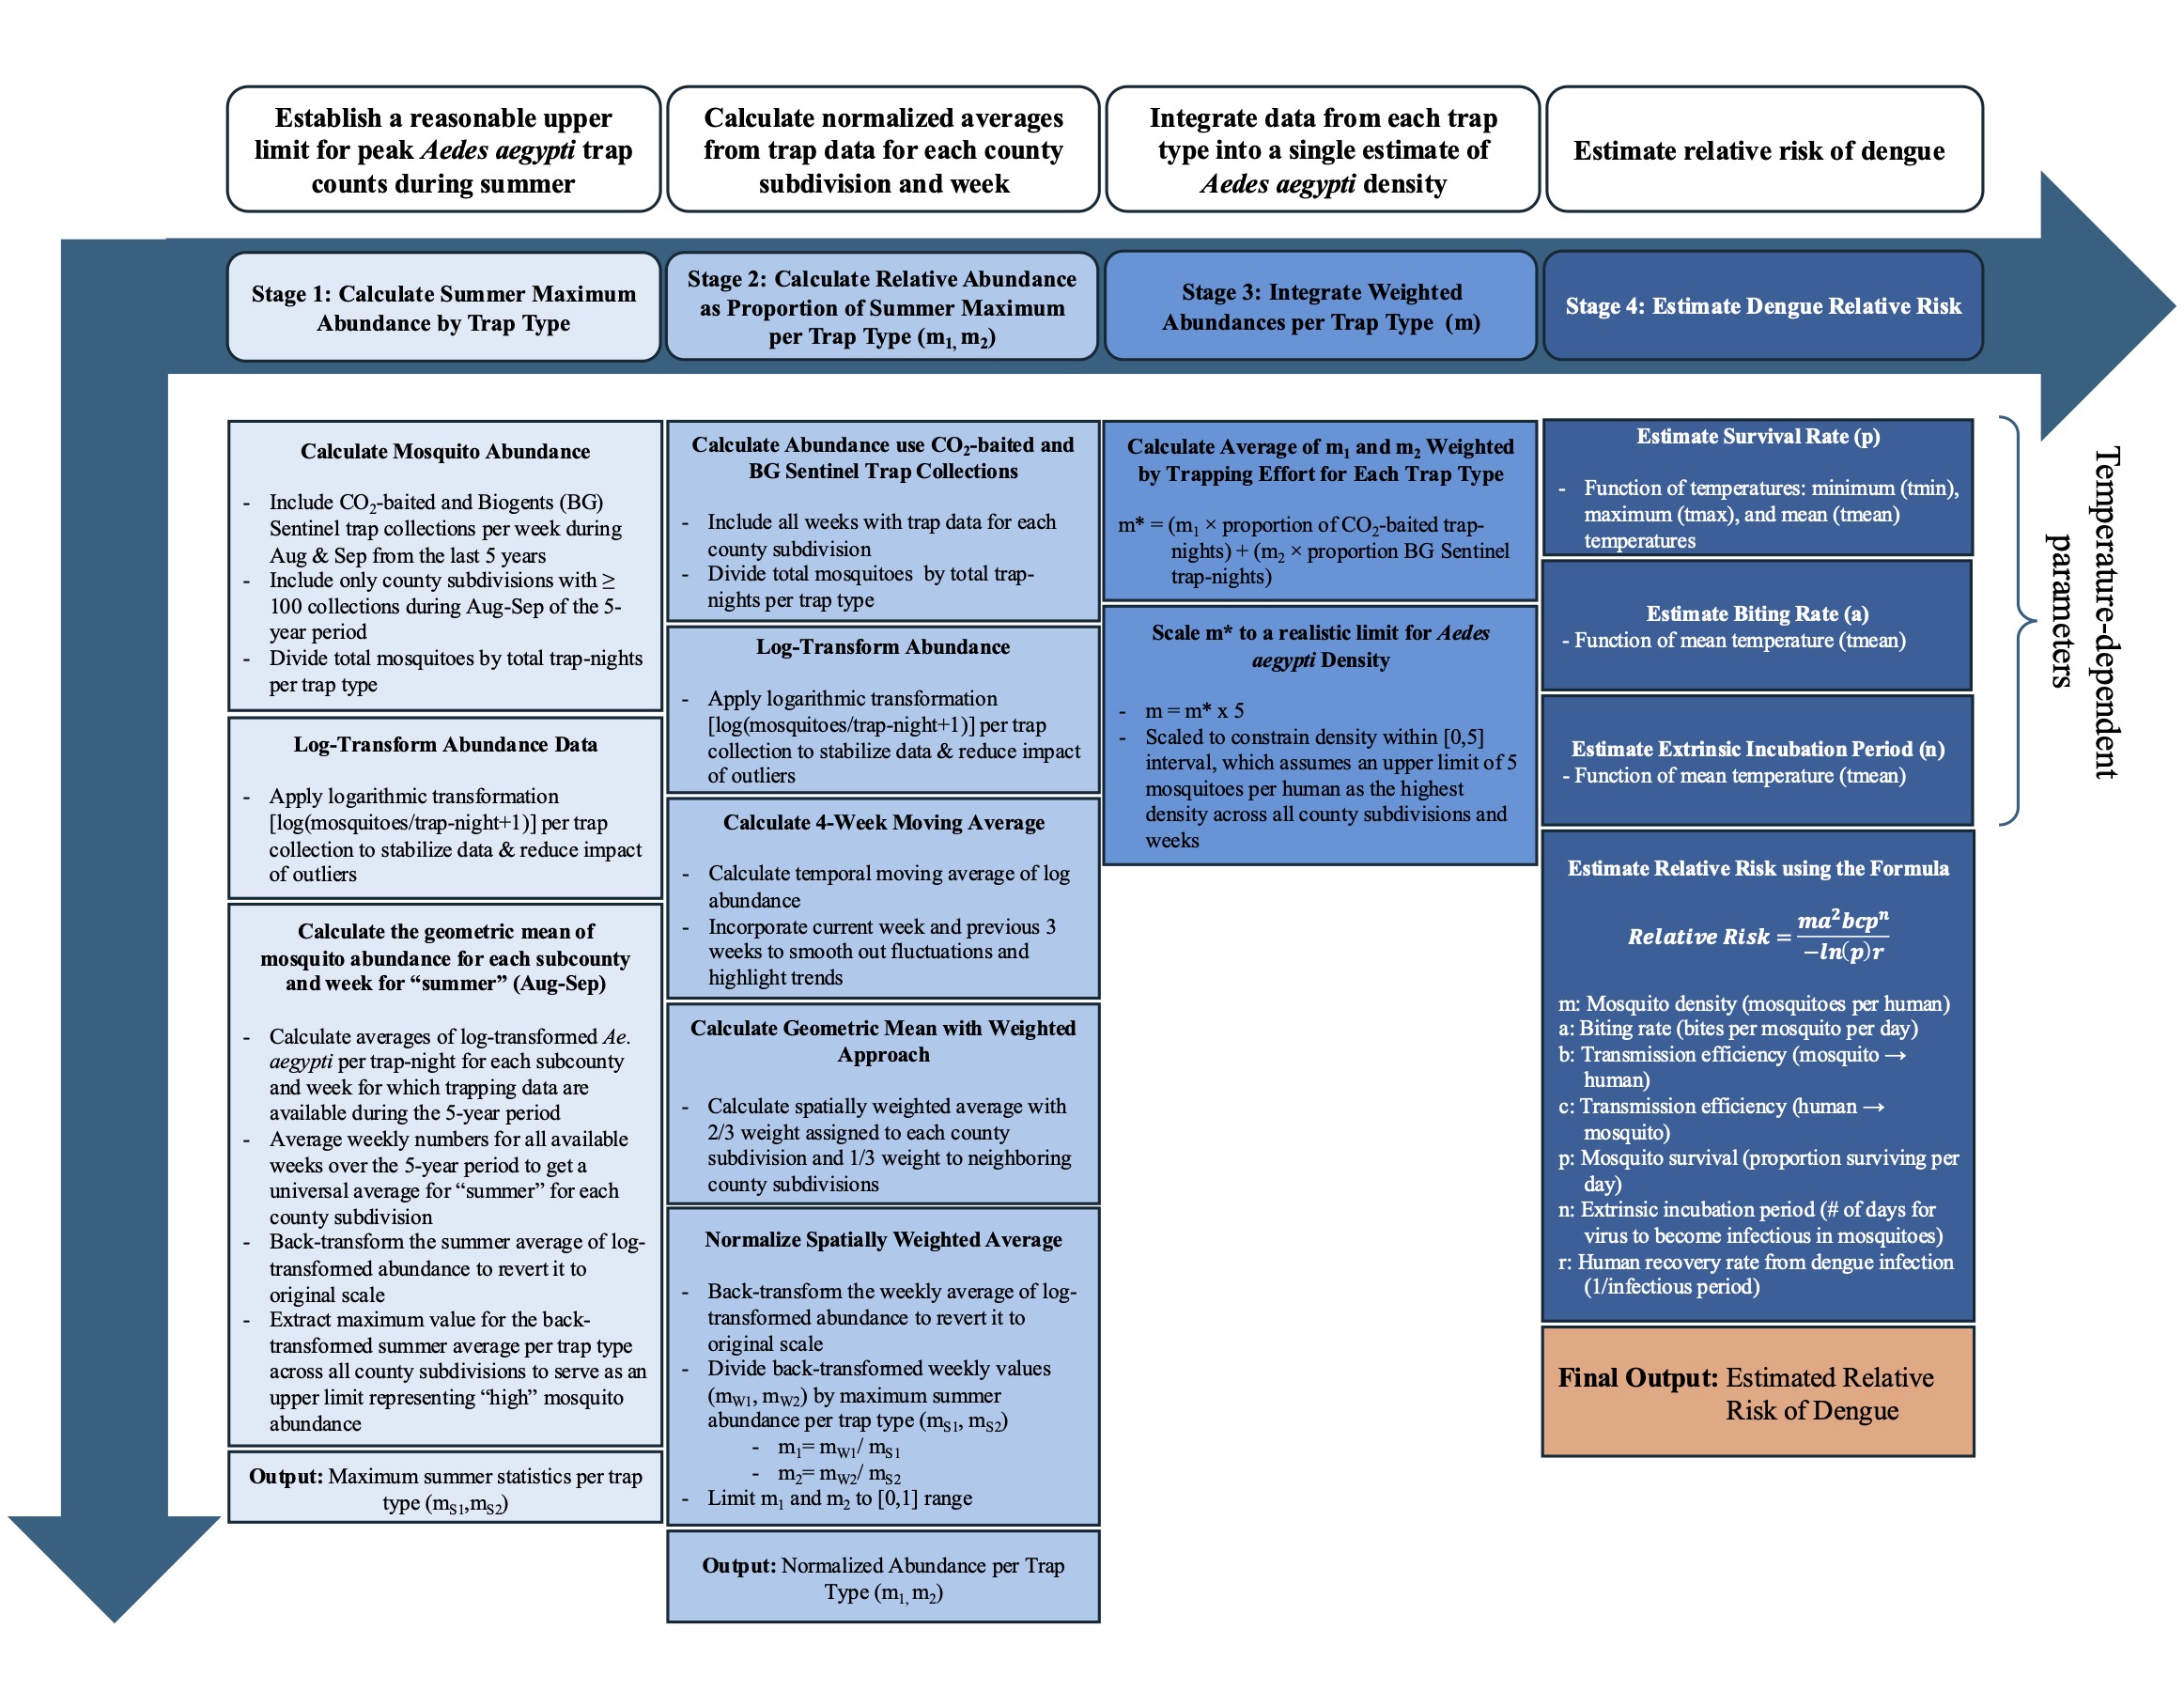
The following flowchart summarizes this process.

